Table of Contents
Nearly all-day traders have heard of Fibonacci extensions or fib time cycles. In this article, we will outline the correct methods to use Fibonacci Extensions to find trend reversal price levels. In this post, we will discuss various aspects of Fibonacci Trading, including Market Fractal Waves, Elliot Wave and Fibonacci Levels, Applying Fibonacci Extensions for Trend Projections, Improving the Odds of Reversal in A Trend, and Chart Mysticism.
1. Introduction To Fibonacci Extensions
Nearly every day trader has heard of Fibonacci extensions, retracements, or fib time cycles. Fibonacci levels are talked about extensively in many Technical Analysis books. Some day traders feel as if they are dictated by some mystical law of the universe (we do see some merit in using them with swing trades to find good exit points or retracement levels). Fibonacci trading can easily be automated, and a Fibonacci algorithmic trading system can be created. However, in our experience, this is more of an Art than it is a science. With numerous portfolio backtest reports, we have rarely found a Fibonacci algorithmic trading system that is successful. The algo systems we design are based more on fundamental market inefficiencies; see our results.
Elliot Wave and Fibonacci Levels
Often Fibonacci levels are used in conjunction with Elliot Wave studies. Personally, in my experience as a day trader and as an automated trader/algo trader, I have found no positive expectancy from using Elliot Wave. Disclaimer: I am not saying it does not work. As long as it works for you and makes you money, that is all that matters. One advantage I have found from Elliot wave in my swing trading is that it allows you to distinguish if the market is in a trend or counter-trend position. The significance of wave counts can be due to cycles of crowd behaviour where certain patterns often repeat in waves.
2. Market Fractal Waves
Crowd behaviour in markets and popular stocks can easily be seen on their corresponding price charts. Bear in mind, price charts are simply reflections of the state of the psychology of the group participating in the market. If one can determine if the market is trending or counter-trending, then this can signal to the trader whether to be long or short. The basic principle has always been seen that trends regularly begin to unfold in five waves and counter-trends unfold in three waves. No matter how you trade, any day-trader can tell you that often after a fast trend has exhausted itself, we usually have a fast correction and then the original trend resumes. Figuring out if the trend will resume or the point at which a trend is likely to reverse is the hard part.
3. Applying Fibonacci Extensions for Trend Projections
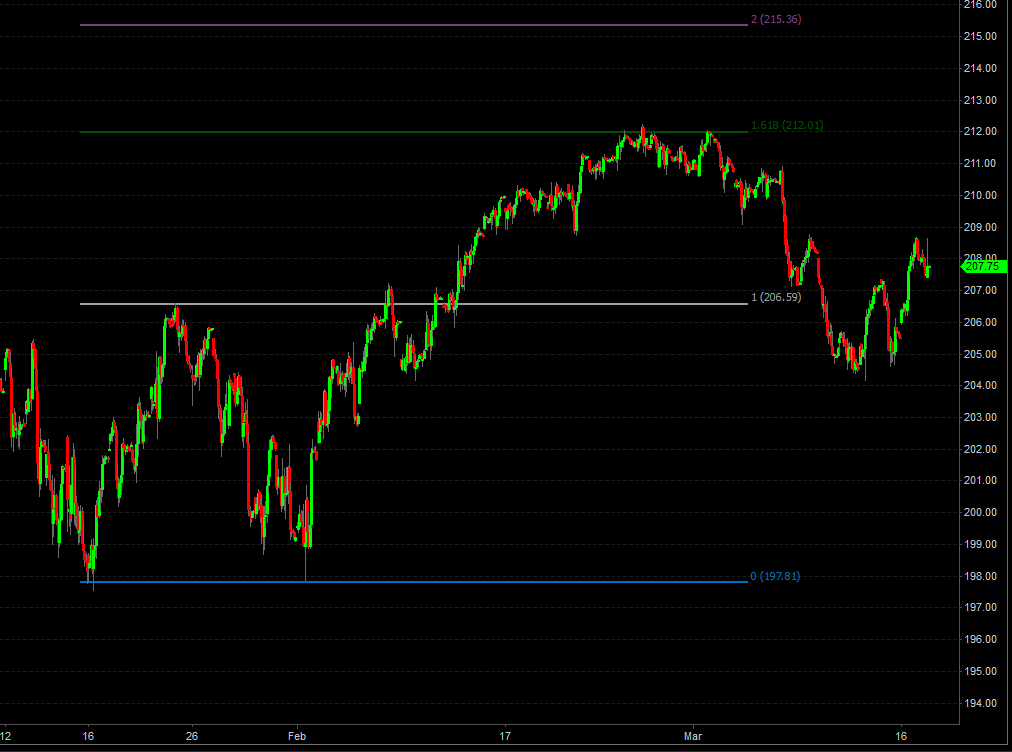
In our example, we will use the SPY index with a 60-minute chart. We will demonstrate what values and levels are good price points to find trend projections. What we find time and time again is that a projection of 1.618 or 2.0 from a major swing high to a swing low can often give all participants in the market a good indication of a common price projection. If you are long, then often traders like to take some of their profits at these points or reverse their positions.
An example from Jan 2015 to March 2015 on SPY
So unlike other Fib traders, first I like to look for a big swing high to swing low. In this case, 206.59 swing high and swing low at 197.81. Now the first extensions are the Fib 1.618 line, which is calculated as 61.8% of (swing high minus swing low) and extended from the swing high point. From the first image, we can see:
- As it was a big swing high to swing low fractal wave – we expect the first entry at Fib line 1.618 to be a good entry point.
- This price level is the current market top and an easy level to trade. It can be a very good set-up for a counter-trend day trader.
- Most traders will never know if this is going to lead to a trend reversal – news could come out which could change the entire situation. However, what I find from back-testing is that from a big swing high to swing low a good retracement point is close to the Fib 1.0 or last swing high point, e.g., in this case at 206.59. This would generally be the target point if you entered a short trade at the Fibonacci reversal level.
- Fibonacci strategies struggled consistently in 2017, and many have abandoned methodologies like Elliot Wave entirely. Click to see why 2017 was a difficult year for Quant funds?
4. Improving the Odds of Reversal in A Trend
With some practice and some backtesting, you can find which types of fractal waves offer the best opportunities for counter-trend trades. However, we can often improve our entry timing and further the possibility of a reversal by using other Fibonacci lines in confluence to form resistance around certain levels.
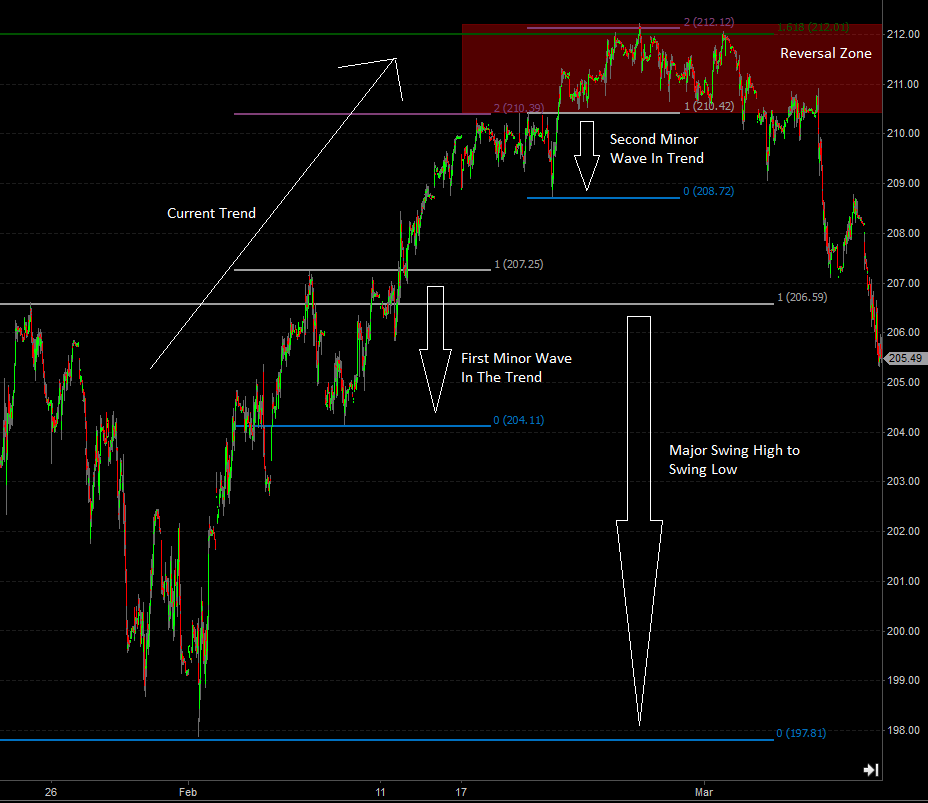
The more confluence and cluster of fib lines around a general price zone, the bigger the chance of a reversal point. These types of trades can offer excellent risk to reward. So following on from the previous example, we can change our chart time frame to a 15-minute chart to look for more extension zones (I like to first look at the bigger picture on higher time frames and then start to look at shorter time frames to find smaller waves).
Notes from looking at the second chart image: For any new day trader or potential algorithmic trader, we can see from this post that we can pretty much start with a simple hypothesis and then work on the same hypothesis from a different angle. Then we can see that by modifying risk/reward for the strategy, we can change a losing strategy into a winning one. If you wanted to continue with this particular strategy, you could figure out and design filters where you expect this system to fail. Another example of a day trading strategy is a Second Day Gap Algorithm.
5. Why We Would Not Trade This Strategy
- I find a small swing high to swing low within the current trend – particularly the first waves always have a Fib 2.0 extensions or 200% of the minor swing high to swing low point (this is outlined in the image as the first minor wave within the trend, and we have Fib 2.0 extension value at 210.37).
- The only other minor wave we have is a small one at 210.42 and is labeled second minor wave. Its Fib 2.0 extension is exactly at level 212.12.
- Now we have a decent sell zone created (the shaded rectangle has become the sell zone).
- Backtesting this as an automated trading strategy has given me the best results when we have at least 2 minor waves within the trend which then line up with the fib extension from the major wave. In this case, our sell zone is from 210.39 to 212.12. The main aim is to find a trading edge using Fibonacci levels as your trading methodology.
- Before we enter our short trade, we want to wait for that second minor swing wave 2 in the trend to begin before entering, so we take the best entry point at 212.01.
- This confluence of fib extensions often leads to quick counter-trend trades which can be made with very small stops and decent rewards. Try creating some rules for a Fibonacci strategy and then test different stops and targets to create your own trading algorithm. The beauty of algorithmic trading is that we can portfolio backtest hundreds of ideas quickly and ensure that our final strategy has a statistical positive expectancy. Stops can certainly impact any Fibonacci strategy and it can be important to discuss, do need stops with algo systems?
6. Chart Mysticism
Fib extensions will not work consistently. Even if there is a major confluence sell zone going on, it does not mean the price will stop magically and reverse. You want to create a system around finding these sell zones and then finding a good place to put stops and targets (both should dynamically change to the current market price). You can easily create a low-risk, high-payoff strategy around price exhaustion (Fib confluence zones).
Fib extensions are levels that many traders look at for profit-taking or counter-trading. It somewhat becomes a self-fulfilling prophecy on why they work. There are many other examples of how to use the Golden Ratio to make trading systems.
However, do not just apply Fib extensions loosely, try to keep them relevant to at least the 60-minute chart. Looking too far out can sometimes lead to values that just don’t work. The best thing to do is backtest ideas around Fib extensions and attempt to create counter-trend strategies or mean reverting systems – that way you can create an algorithm which gives the best-desired results and quantifies what works and what does not. Your algorithmic trading strategy must quantify a market inefficiency or behaviour beyond randomness.
The most important aspect of finding the correct methodology of using Fibonacci levels is backtesting your strategies. Algorithmic Trading is very important in today’s markets, and most fund managers or trading professionals incorporate automated trading systems in their investment portfolios like we do at Quant Savvy.


