
Table of Contents
Evaluating Stop Methods for Algorithmic Trading Systems
In this article, we evaluate percentage stops, trailing stops, and other commonly used stops in the context of algorithmic trading systems. Every day traders and system traders have always been told to use some type of stop. Many day traders understand the difficulty in setting stops. Stops too tight are destined to get hit more often, while stops too loose can lead to a potential colossal loser. We want to know if the commonly used stops discussed in forums and books really work with algorithmic trading systems. We test various stops on a sample system, Chimera Bot, below.
Psychological Repercussions of Stops for Manual Traders:
- Fixed tight stops lead to lower risk on an individual trade but will undoubtedly lead to a lower win/loss ratio. For manual non-system traders, it can be challenging to be repetitively stopped out and then continue to follow your rules consistently.
- Large stops lead to a higher win/loss ratio, but the occasional significant loss can cause the common day trader to become shell-shocked.
- Trailing stops: every new trader recites the adage of “never let a winner turn into a loser,” so a trail is employed. Yet, how many times have you seen your trade get stopped out, only to have the market shift into a strong trend in your favor?
Commonly Used Algorithmic Trading Stop Methods:
- Fixed percentage stop
- Trailing stops – these can be percentage, dollar, points, etc.
- Universal indicator stops, e.g., Stochastic, Moving average crossover
- Price action stop – can be something as simple as the lowest low in the last 5 bars
- Support and resistance-based stops
- Volatility-based stops – many use ATR
We will analyze the performance of these various stops and measure their impact on essential metrics such as Sharpe Ratio, Profit Factor, and Drawdown.
Baseline:
- Quant Savvy Chimera Bot 5
- Market: YM 5min Chart, daytrade only (no overnight holding)
- Direction: Algo systems Chimera Bot 5 trades only on the Short side.
- Stops: All stops for this strategy have been removed.
- Targets: Using the normal system targets.
- Notes: Performance results are based on data from the beginning of 2007 until the end of 2017. The system uses no indicators, and entries are independent of targets and stops.
- Baseline results: If the target is not hit, the exit is at 3:15 PM Central.
(Click images to expand)
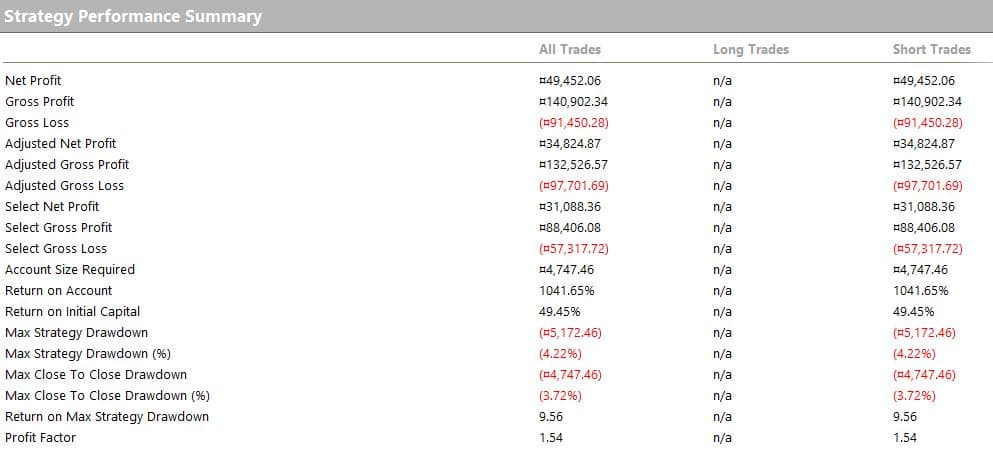
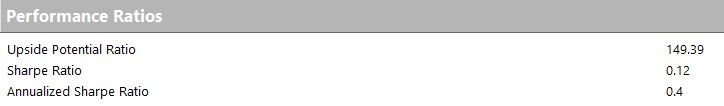
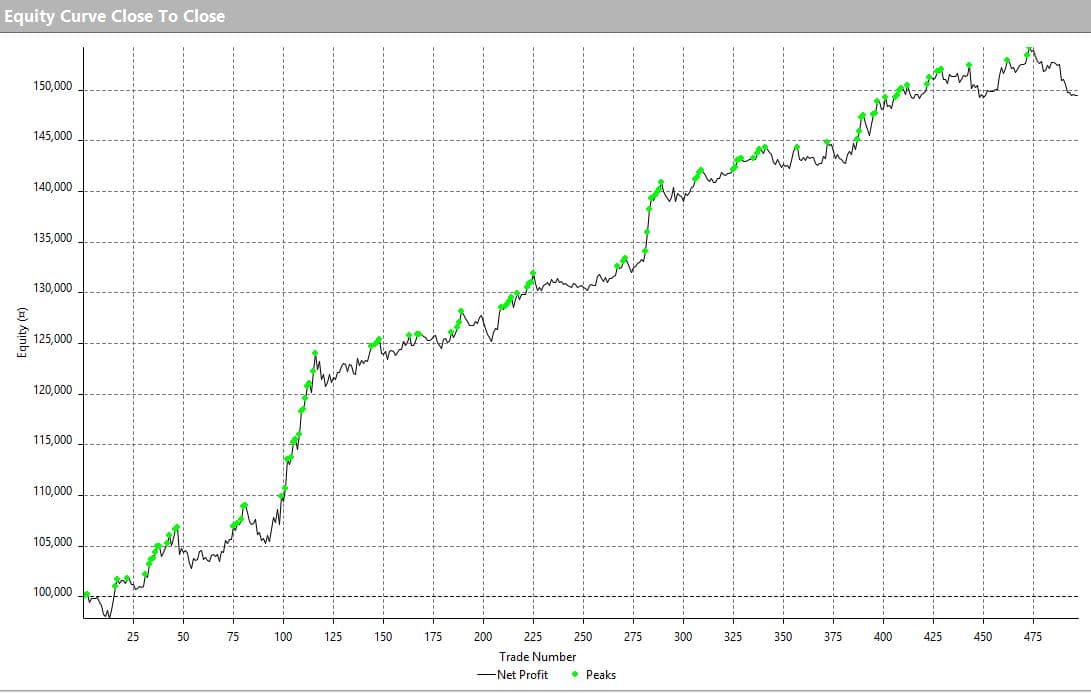
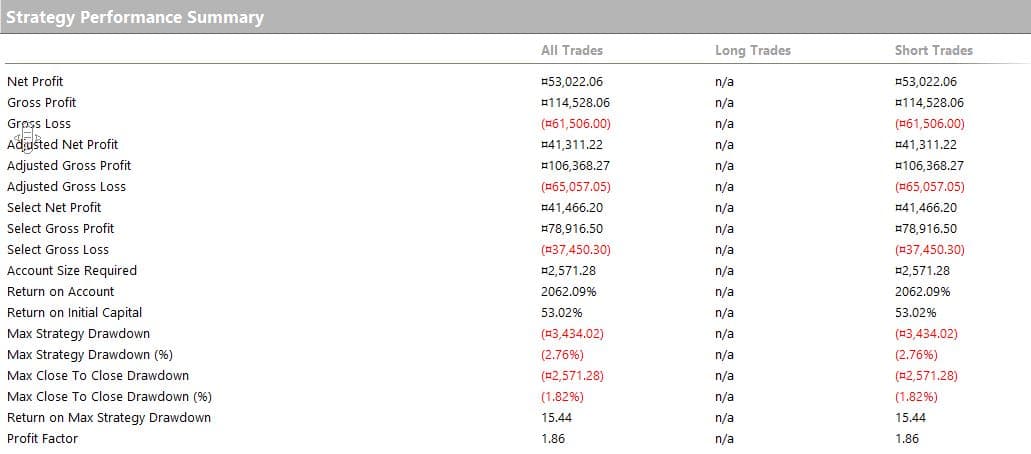
When removing all the stops, we still have a profit factor of 1.54 and a Sharpe ratio of 0.4. The largest losing trade without stops was -$2,604, and the close-to-close drawdown was -$4,747 (we still feel drawdown is a misleading metric, read this post to see why).
1. How Do Traditional Stop Losses Affect the Algo System Performance?
We will run the results with various stops, showing results based on different optimizations, even though we would never optimize our systems for this study.
2. Study 1: Fixed Percentage Stops – 0.25% to 2% of Market Range
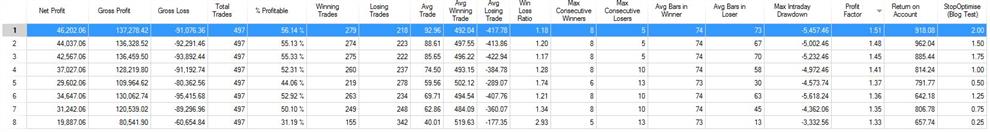
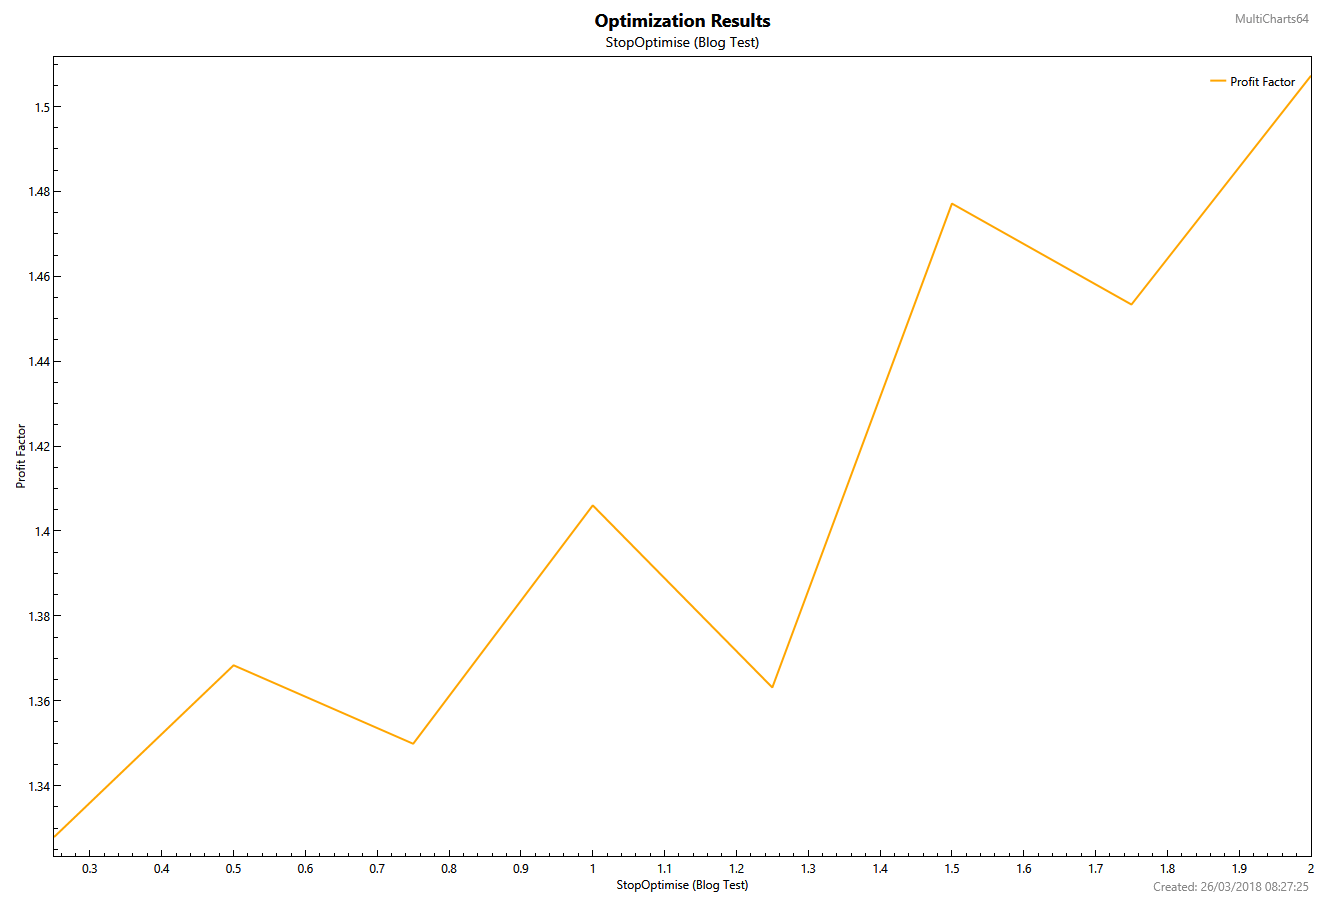
The results show that every percentage stop reduced profit factor and lowered the overall performance of the system.
3. Study 2: Moving Average Crossover Stop
- With the independent entry, we need the fast-moving average to cross or stay lower than the slow-moving average.
- When the fast-moving average crosses above the slow-moving average, we will exit the next bar at the market.
- We have optimized for the slow and fast-moving average to get the results.
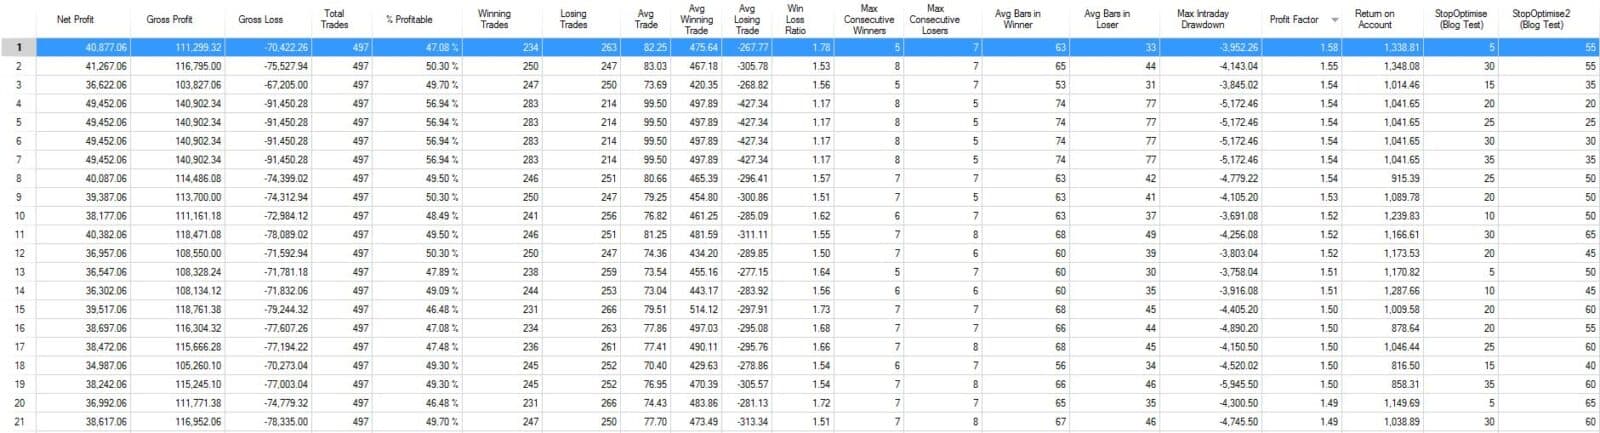
Looking at the results – which will be curve-fitted as we are using a computer to optimize the two parameters for best performance. Still, we do improve on the baseline results with 2 different combinations of fast and slow-moving average.
- Fast (5) and Slow (55) gives the best profit factor and reduces intraday drawdown.
- Fast (30) and Slow (55) gives the second-best profit factor.
The results above are generated after testing 500 simulations of best parameters for the moving averages, yet we only get two results which barely improve the performance and therefore have extreme data mining bias hence cannot be used.
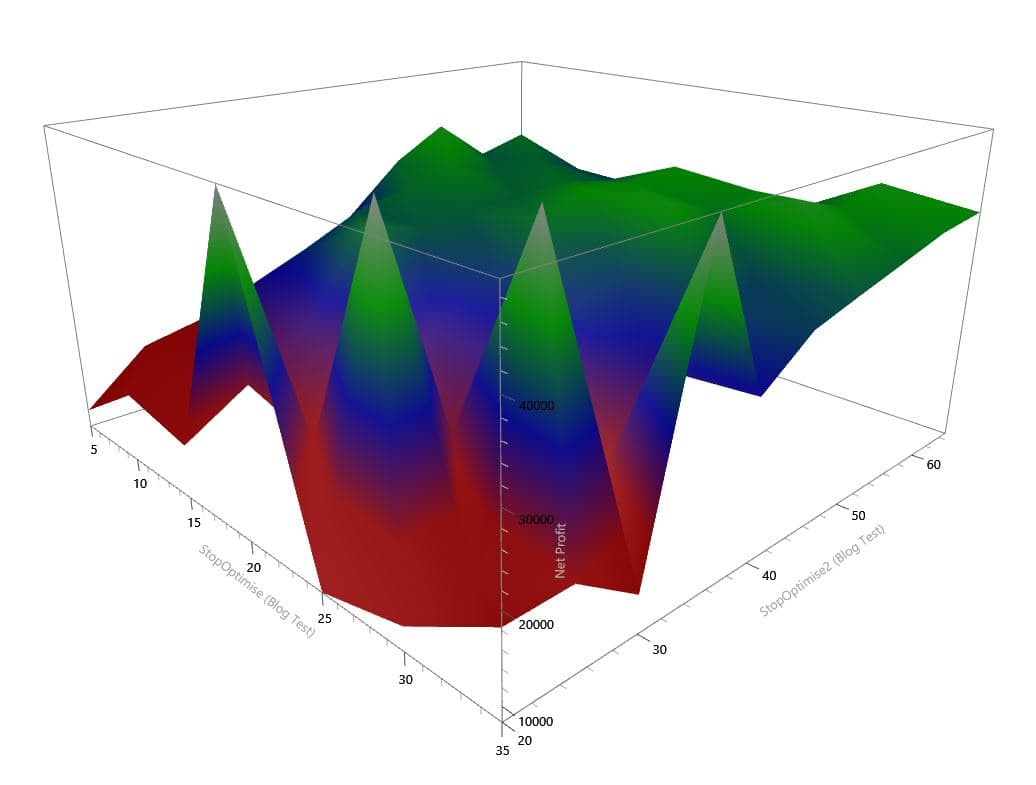
4. Study 3: Bollinger Band Stop
This indicator is a favorite stop for many day traders as it considers current market volatility and range. Mean reverting systems love the Bollinger band – we at Quant Savvy find this to be another meaningless indicator, however. We place our stop at the upper Bollinger Band and optimize the parameter from 1.0 to 5.0 standard deviations, and we optimize the length from 5 – 65.
The results are more consistent with the Bollinger Band study; the 3D optimization report does show gradual improvement and stable region for parameter optimization. 14 to 32 in length and 4 to 5 in standard deviation is the stable zone. Having a stable area is essential when optimizing algo system parameters as within the neighborhood of best fit we still want to see adequate performance. If there is no stable zone, then any change in market conditions will mean odds are your optimized parameters will not work. Ideally, one should never optimize in the first place.
- The Bollinger Bands do improve the profit Factor and Net Profit/Drawdown. However, out of all the 500 plus optimizations we tested, less than 27 beat profit factors of the baseline.
- We had a Sharpe ratio of 0.45.
- The results do show some promise for Bollinger Band stop, but one thing to note is that the best parameter optimization of length: 14 and Standard Deviation: 4.75, we only got less than 20% of trades hit the stop….
- Would you use this type of optimized stop which barely improves the Profit Factor? At Quant Savvy, we would not!
5. Study 4: Price Action Stop
There are many definitions of trading price action. Very few traders understand what it means, and you rarely find two in agreement on how to use it. As there are many types of price action stops (beyond the scope of this study), in this study, we will focus on the two most commonly used price action stops:
- Highest (high, ‘x’ number of bars) looking backwards, this will be optimized.
- ‘X’ number of bars in a row up (against our short position), this will be optimized.
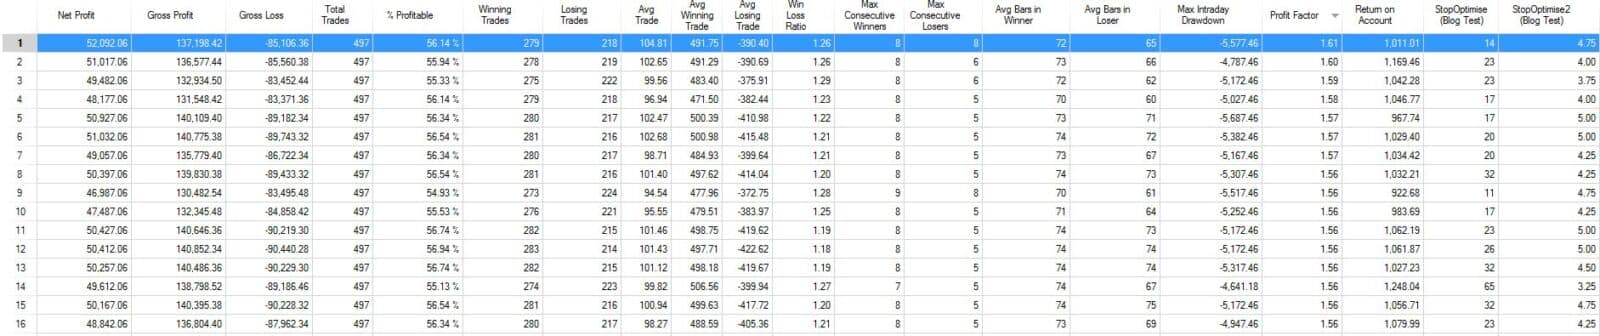
Results for Highest (high, ‘x’ number of bars)
- We do this for 5 to 50 bars looking backwards.
This performs particularly poorly and not even optimized parameters can improve the results.
Results for ‘X’ number of bars in a row where the close is greater than the previous close
- We do this for x = 2 to x = 10.
The data above only shows two optimizations where it performs better than the baseline system with no stops. Therefore, we can assume this method, in its simplest form, is not beneficial.
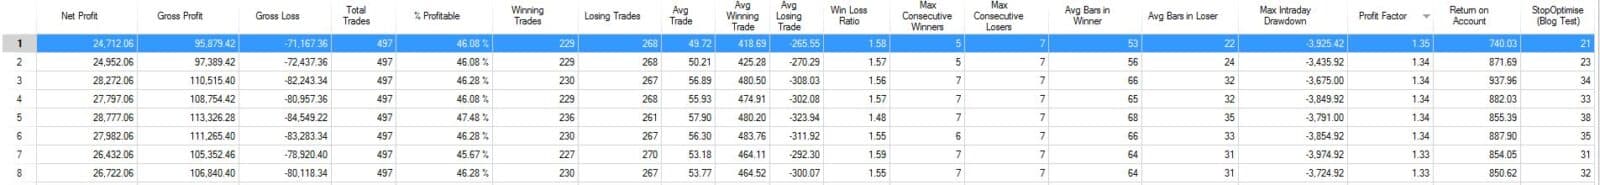
6. Study 5: Support and Resistance-Based Stop
We can use the Open, High, Low, and Close of the previous day’s actions to create some support and resistance points in a shorter timeframe. We will, therefore, test if the past day’s open/high/close or low makes a good stop for the automated trading system.
- We take the entry price and place a stop at a point of interest above this level, e.g., if the entry price is lower than yesterday’s close but above yesterday’s low, then we will test stops at both yesterday’s close and yesterday’s high. This methodology will be applied to all of the various iterations.
- We will optimize for set 1 in which stops will be applied to the next nearest point of interest and then optimize set 2 in which stops will be applied to the second nearest point of interest. Points of interest being yesterday’s: open, close, high, and low.

The performance is weaker than baseline performance, showing that yesterday’s points of interest have little impact on improving system stops. This methodology could be enhanced and expanded much further using multiple points of interest spanning many days or timeframes, etc. However, for this simple study, we like to see some improvement in the shorter timeframe before moving onto bigger timeframes. A good rule should perform on all timeframes.
7. Study 6: Volatility Stop Using Average True Range
- This is a very commonly used stop. We will pick different lengths and optimize.
- We optimize the ATR length from 0.2 – 6 with 0.1 intervals.
Result: this shows zero improvements in performance and, in fact, makes performance far worse.
8. Study 7: Trailing Stop
This method is probably one of the most common stops. No trader likes to see a positive trade turn into a negative one. Nevertheless, this stop requires some degree of skill and flexibility. For quant traders, we must emphasize that you should play around with different practices of employing a trail. For this study, we will apply something simple:
Test A:
- We will start trailing when the market goes in our favor using market percentage; this will be optimized.
- We, therefore, have two parameters. The first parameter is how far the market has moved in our favor, e.g., if the low is less than entry price minus 0.2%, a trail can begin.
- When the trail begins, we have the second parameter which is optimized and will again trail based on a fixed percentage.
- The machine will optimize for both parameters starting from 0.2% to 2.0% in increments of 0.2%. The trail will be calculated from the most recent bar high.

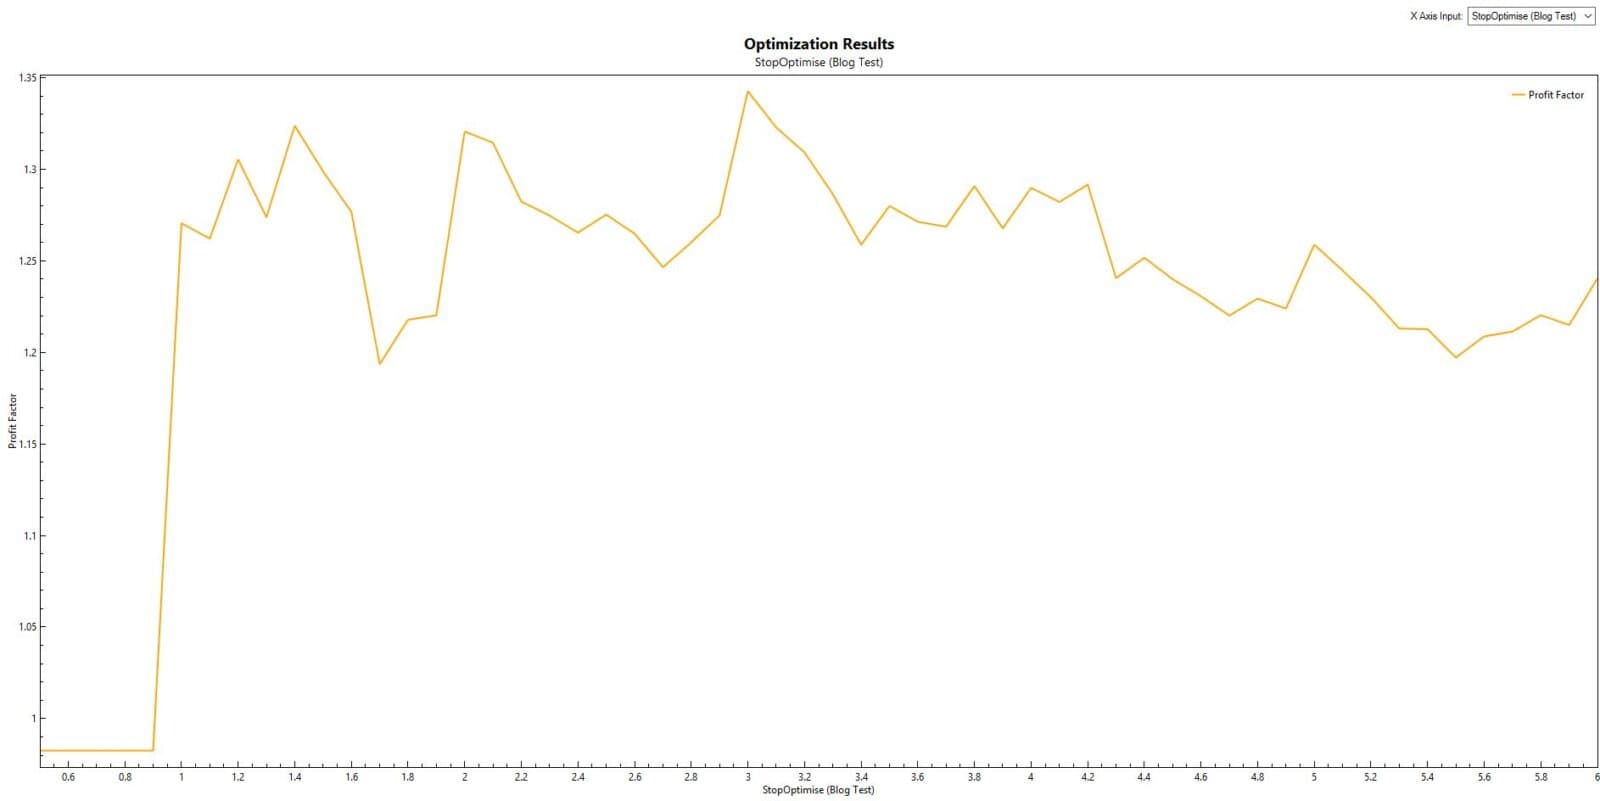
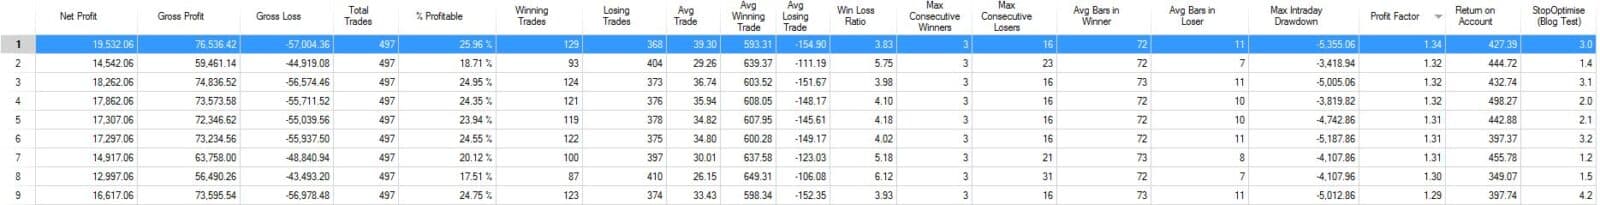
Results: surprisingly, the trails do not improve performance. If the market goes in our favor by 0.7%, for example, then we would want a trail of 1.1% from the most recent bar high.
Test B:
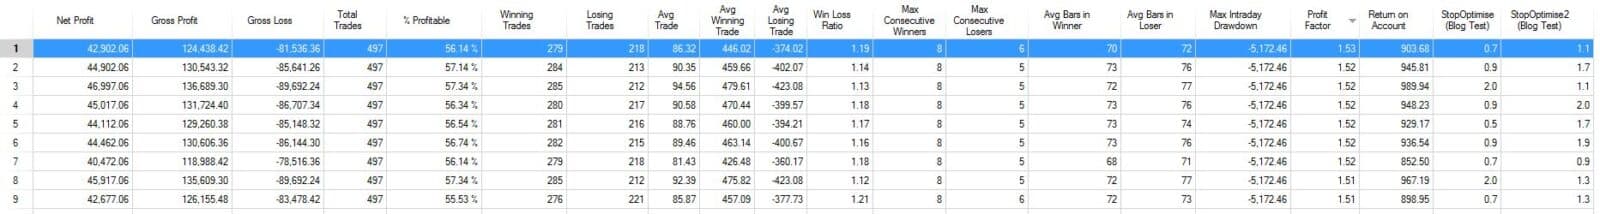
Result: Test B shows even weaker performance, so this type of trailing stop should be disregarded.
9. Study 8: Fixed Dollar Stops
In this study, we will not evaluate these types of stops as price rises over time make this meaningless. If you use fixed dollar stops, then make sure to normalize it to the current market price. See this article for more information: Drawdown is a Misleading Metric in Futures Trading
Conclusion: Typical Stops Used by Many Day Traders Do Not Work!
In this post, we have presented an interesting study because we specifically chose a system that is Short only. Every trader knows that trades on the Short side work differently than trades on the long side. Markets often move up in steps and then fall off the edge of a cliff; moves down are usually much faster and more violent. Most other studies of this type usually show that stops tend to improve performance. However, many of these studies are based on longer-term indicators; this study is clearly for day trading only. Moreover, the fact that this is a short-only system cannot be overemphasized as most other studies show long-only systems – these are often easy to fit using trails as markets often move upwards in steps so a trail is relatively easy to apply.
Scope for Further Study
There are hundreds of different stops we can potentially try. In this study, we have not explored other indicators nor price action points such as Pivots. One thing we must point out after years of testing is that indicator-type stops rarely work for day trading, and dollar stops are poorly programmed and make zero sense for rising futures markets. In our experience, we find that volatility stops can work, but the system must adjust to the market data coming in a very short timeframe. We also have seen the benefit of break-even stops and time stops. Support and resistance stops can be programmed with different complexities, and the results for one trader relative to another trader will be dissimilar. There is no correct measure of support and resistance, and every trader has their methodology. The final performance of the Chimera Bot, when we add our specialized non-optimized and non-curve-fitted stops, is as follows: