

Momentum Strategy Summary
In this blog post, we demonstrate to new traders and developers that by taking basic day trading knowledge and creating a logical rule to capture momentum which we can test on in-sample data periods and on correlated markets to ensure there is a positive expectancy.
This is a good starting point particularly for understanding how different market themes will influence profitability and why testing across correlated markets during bear/bull markets is a good idea.
The implemented momentum strategy rule simply means that it is tracking the overall trend of the market which is in the closing phase of a very strong Bull market.
“This is a good starting point for day traders transitioning to automated trading”
Many day traders use momentum strategies to take advantage of trends. In this post we create a simple momentum strategy without using traditional indicators, we test it on the Emini Equity futures markets with both in-sample and out-of-sample testing. We will create a momentum strategy for the day trading setting only.
Audience: Day traders transitioning to automated trading. Technical traders. New automated traders.
Table of Contents
1. What is a momentum strategy?
A momentum strategy is designed to capitalize on existing market trends. It involves going long stocks, futures or market ETFs showing upward-trending prices and short the respective assets with downward-trending prices. Most momentum strategies are utilized on longer-term charts but we want to test if they can work intraday.
Idea: Buying Market Strength (Day trading only strategy with no overnight holding).

– When the market starts trending and setting new five day high (day sessions only) then we expect this momentum to follow through to the next day trading session. Our goal is to design rules which indicate the market is strong and trending, we then buy at the open of the next session and sell at the close.
2. Main Rule: If the previous day’s high was greater than the preceding four days then we buy the opening bar next session
//MARKET TRENDING STRATEGY
if marketposition = 0 and date <> date[1]
and highd(1) > maxlist(highd(2),highd(3),highd(4),highd(5)) //RULE
then buy this bar at close;

//EXIT END OF DAY
if marketposition = 1 and time >= 1515 then sell this bar on close;
In-sample and Out-of-sample testing
It is widely known that significant in-sample evidence of predictability does not guarantee significant out-of-sample predictability. This is often interpreted as an indication that in-sample evidence is likely to be spurious and should be discounted. Out-of-sample testing is a way to guard against curve-fitting. We use an uncomplicated in-sample and out of sample for this test. However, the following in-sample and out-of-sample testing could be used such as dividing historical data into two parts, see the image below:

The in-sample data is used to create and optimize your strategy. After the strategy is refined, traders might choose one variation to test on the out-of-sample data. The backtesting can be carried out in the following steps:
- Setting data ranges for the in-sample and out-of-sample period
- Testing your idea on the in-sample data
- Tweaking your strategy until you feel done
- Validating your edge on the out-of-sample
However, with two different time periods, the results are almost always going to be at least a little different. The most challenging situation is if the original sample is a bull market and the out-of-sample is a bearish period or vice versa. Thus, to get the most accurate testing results, the out-of-sample data should be used only once. Otherwise, traders convert out-of-sample data to in-sample data without realizing it – read more. The main premise of out-of-sample testing is that true market behavior will be consistent throughout both data sets, while random market noise will not.
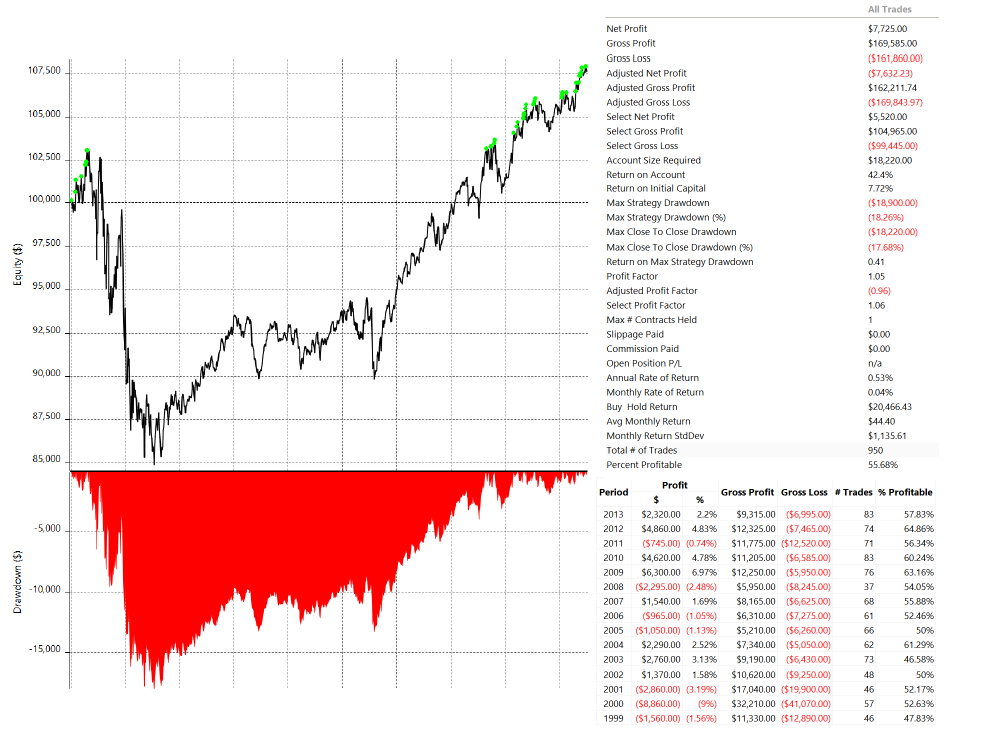
3. Test 1 Results In Sample (1997-2014 ES):
Initial results show a modest edge and a profit factor of 1.2 which is promising (please keep in mind we have not added commission and slippage which will reduce the performance significantly). The winning percentage is healthy 55.43%. The strategy design is very basic with no stops or targets and just exits at the end of the day.
Drawdown during this period was only -$4,862
The net dollar return does not beat the buy and hold performance but this is expected and often a misleading metric. The buy and hold performance would face a huge drawdown forcing many traders to liquidate their positions due to margin calls especially if trading on leverage. The objective of this momentum strategy or any automated trading strategy is not to just beat the Buy and Hold return but to beat the benchmark on a risk-adjusted basis. However, many traders rush towards short-term profits without considering the performance of their strategies during market crashes.
Using this momentum strategy, the system generates positive alpha in the drawdown years relative to the buy and hold the return of the market and does not suffer any significant loss during the Dot Com crash in 2001 to 2003 and the Financial Crisis of 2008. In fact, looking at the performance we can see that in 2008 we had a positive performance which is surprising for a buy the only strategy.
Buy and Hold Strategy Results During This Period
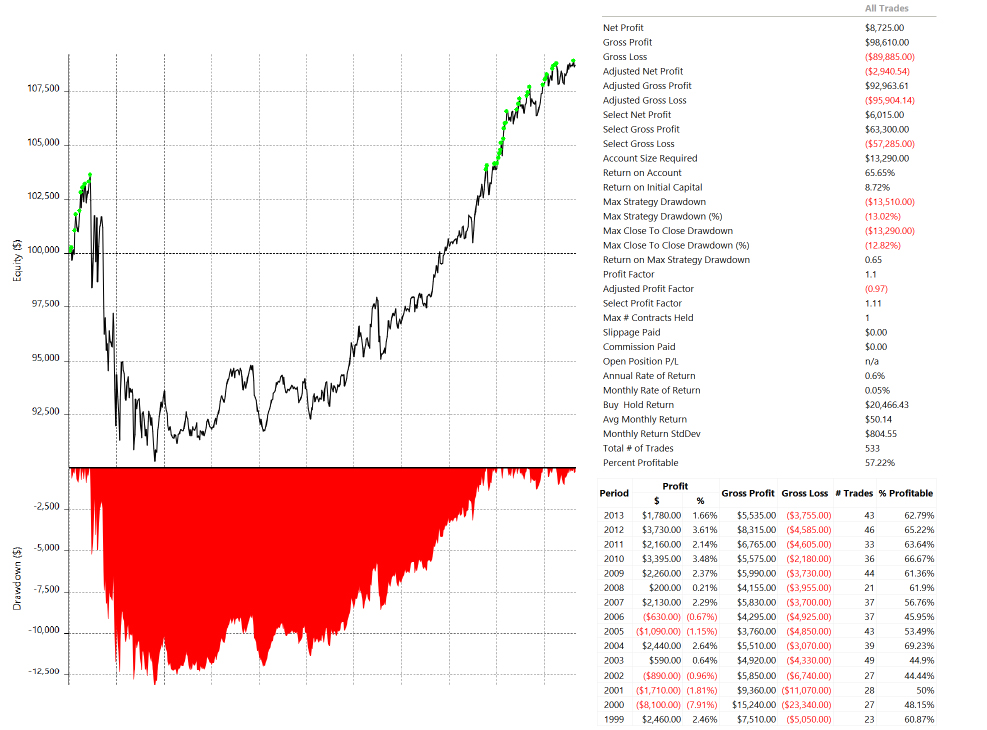
4. Test 2 Results Out of Sample (2014 – 2020 ES)
This unsophisticated momentum strategy passes this very basic out of sample testing and achieves a profit factor of 1.18. The drawdown is higher than the in-sample period which is anticipated as we are trading a fixed one futures contract and the market price has risen considerably over time meaning the avg dollar per trade will increase significantly – read more.
In 2020 the trading strategy has performed admirably even during the COVID crash period in March. The strategy has passed the very basic out of sample testing for the ES market. So should investors really fear of market crashes? Or are you ready to take advantage of the bubble in 2020 with the sophisticated algorithmic trading systems?
Buy and Hold Strategy Results During This Period
Robustness Testing
There has been no machine optimisation for this day trading strategy and we have not used any indicators. However, we have selected a simple rule such as the previous days high > preceding four days high – this rule can be inferred as optimised as we could easily choose a different value for the number of days to look back.
So lets test if we were lucky in deciding to look back over the last 5 days or would the performance be very different if we were to look back only 2 days or 13 days for example. We can create a look back parameter and run an optimization:
We changed the number of days to look-back from 2 to 18 and the results are shown below. We see that net profit and number of trades is highest if we only look-back the last 3 days but the profit factor is highest when we look-back 17 days. Profit factor will inevitably be higher when the number of trades decreases so this is not so important. What is important is that every look back period is positive and using 3,4,5,6,7,8 days leads to equal performance.
We do not need to use walk-forward analysis and we will stick with the 5 look back period which was selected with some tacit knowledge (market experience) at the start of this strategy construction.
Testing On Other Markets
Any day trading system which shows positive expectancy on one market should show solid performance other correlated markets. We can improve our robustness testing and apply the same strategy to the Nasdaq futures market.
The NQ In Sample Results (1999 to 2014 NQ):
The strategy disappoints during the Dot Com Crash where the NQ crashed nearly 90% from its all-time highs.
NQ Out of Sample Performance
Results show positive expectancy but we must take into account the NQ has had a meteoric rise during this period. Again, we see the strategy is tracking the long term trend of the market considerably.
Is it possible to improve this strategy for the NQ during the Dot Com Crash?
Ideally, we want to create a long-only system which is uncorrelated to the longer-term market performance and generates positive alpha, especially during bear markets. If the strategy is just tracking the longer-term market trend then it is pointless and you would be better off investing your money in an index and creating a money management algorithm to adjust position sizing or scaling into positions during bull and bear markets. All traders who would use this kind of strategy would be considered as gamblers rather than investors. People who are really looking for long-term consistent profits trust only sophisticated algorithmic trading systems with proven results.
5. Improving the Strategy Signal – Filter Rules
We can be more selective in our trades by adding filters, this can be done with some tacit knowledge of how markets operate. Our goal is to introduce a filter without curve fitting, this can be achieved by using market experience or logic, the last thing we want to do is introduce an indicator and optimise this over the entire data set.
Filter 1: Yesterdays high is greater than the previous 4 days high by a reasonable margin
This rule is designed to remove trades which ten to occur in range-bound markets in which a clear trend has not been established and the lookback period high was exceeded by a very small amount. Let’s introduce a filter which ensures the high was taken out by a considerable level so we can avoid bear market bounces and range-bound market moves (this is the reasoning anyway).
Code Logic: Yesterday’s high must exceed the preceding four days high by the daily average true range * 0.15 (this parameter has been not been optimised but seems sensible).
We are testing this rule now only on the NQ (weakest market) from 1999 to 2014 in-sample period. We want to avoid looking at the results on any other market or time period.
Results: This shows an improvement in the performance of the NQ market during the in-sample period. The drawdown has decreased and the system achieves positive alpha relative to the benchmark NQ buy and hold during this period. This meagre filter cuts out very few trades whilst improving profit factor and is a beneficial unoptimised filter.
Without testing the performance of filter 1 on any other market or time period we decide to introduce just one more filter.
Filter 2: Yesterday volatility must exceed the preceding day’s volatility.
We argue based on existing market knowledge that in a strong uptrend we often see the range increasing as the trend gets more powerful and additional buyers come on board. We also tend to get an increase in volume in a strong trend that is expected to follow through.
Code Logic: Yesterday’s volatility > Preceding day’s volatility
We are testing this rule alongside Filter 1 again only on the NQ (weakest market) from 1999 to 2014 in-sample period. We want to avoid looking at the results on any other market or time period.
Results: This shows another enhancement in performance, reduces the drawdown and achieves higher profits with fewer trades (fewer trades means less slippage and transaction costs in the future). The downside is that the number of trades has decreased by nearly 40%, this is not a good thing in the testing process as being too selective can lead to curve fitted systems. You would expect profit factor to increase as trades decrease (ideally when testing you want a maximum number of trades possible with a high-profit factor, this will ensure your entry logic has a real positive expectancy).
Final Test: Add YM (Dow Jones Futures market), run strategy on NQ, YM, ES on the entire sample from 1999 to 2020.
Recap: we have created a day trading momentum strategy with a basic premise to identify a trending market. We tested this on the ES market in-sample period and later tested on the NQ market which showed much weaker performance during the Dot Com Crash of 2000 to 2003. The entry was at the start of the day and exit at the end of the day, so far we have not added any stops or targets. To improve the system we created two basic entry filters and tested this only on the NQ in-sample period from 1999 to 2014.
All Rules:
- Main momentum strategy rule, yesterdays high > preceding four days high.
- Two additional entry filters with no optimisation and tested only on NQ in-sample period.
- NQ, ES, YM markets – trading 1 contract on each market for simplicity.
- We use a day trading 5-minute chart interval.
Results:
Combining markets and trading one contract/unit for each market improves the monthly and annual consistency. Trading all correlated markets with the same system can often ensure better long term performance with smaller drawdowns and more favourable risk-adjusted returns relative to the benchmark buy and hold performance. The results clearly show that adding the other markets improved the weak performance during the dot com crash where the NQ was most affected.
This is a Long only strategy so we must accept it will undoubtedly endure weak performance during a bear market, this is typical. However, we want to achieve positive alpha relative to the benchmark and a much smaller drawdown than a buy and hold strategy. Let’s be honest, no trader or investor would ever sit through the buy and hold 90% decline in the NQ market during the dot com crash nor would many survive the financial crash of 2008. The goal for any strategy is not to perform equally well under all market conditions but to beat the benchmark on a risk-adjusted basis. Our algorithmic trading systems would be an excellent example of strong performance during all market conditions. While your typical buy and hold investor would lose money during all market crash periods, our algorithmic trading systems have continued to show consistent performance in all market conditions.


Advantages of this strategy:
- This strategy is day trade only which means less market exposure. We are limiting risk and extracting strong performance. Capital can be used effectively to trade other markets overnight or early morning e.g. Asian futures markets and European markets.
- Day trade only means better liquidity so as the position size grows we expect less slippage.
- Day trade only means lower margins and an increase in potential leverage.
- Simple rules without optimisation can lead to a robust system.
6. Improvements and Portfolio Commentary
Position Sizing
The next step for this momentum trading strategy would be to design a sophisticated position sizing system. We can smooth performance by trading all correlated markets as we expect correlated trades (daily equity correlation between the ES and NQ is 0.56). However, over time the markets will have different weights and values e.g. the NQ (meteoric price rise) in 2020 is nearly two times the value of the YM in 2020. We can use many position sizing methodologies to improve performance or balance:
- we can increase position size for trades/markets with higher predicted expectancy or a market that is outperforming and has better trending conditions.
- we can balance the market position sizing and weight the number of units traded relative to the market contract value and volatility e.g. we reduce the NQ units trades in 2020 and increase the YM units traded.
- we can test reducing position sizing during bear markets or drawdowns. Alternatively, we can increase position sizing after a series of weak trades.
Testing on other Data Sets and Markets
To further improve the validity of this basic entry rule you can test on other correlated equity futures markets from Asia and Europe. If the strategy is robust then it should perform equally well on other markets.
Stops and Targets
So far we have not added any stop or target logic. For longer-term systems, stops and targets can decrease performance considerably but for day trading systems stops and targets are essential. This momentum strategy can be improved with the addition of effective stops or target logic. Moreover, depending on your overall portfolio construction or trading style you can increase the win % or increase the avg win/loss to suit your own risk propensity. See this post for day trading stop methodology.
Creating a Portfolio
Only beginner traders believe they can find the holy grail of systems which work in all market conditions, this is a pipe dream! We expect this strategy to outperform during bull markets and if it generates positive alpha during a bear market then that is a huge positive. Results show that very weak bear markets like the dot com crash can decrease performance significantly, to improve your portfolio consistency you can introduce a short only system which is designed for Bear market conditions but still achieves moderate performance during bull markets, this could be a volatility-based system. However, we would strongly recommend you to trust professionals handling your investment, as we’ve seen many beginner traders who have lost all their money. In fact, statistics show that nearly 90% of traders lose money and end up quitting. While this percentage varies slightly from study to study, the fact is many beginners will lose regardless their trading methods and practises. For consistent performance with low risk, we strongly advice to trust only experienced trading companies.
Confusing a Bull for Brains
We see many day traders or system traders create strategies and declare they have become a money-printing machine just because of strong performance over the last 6 months. A newbie developer might create a system and only test the original entry rule criteria from 2009 to 2020 and rub their eyes in disbelief at the excellent performance. Testing on other markets in various market conditions proved quickly that in an extended Bear market this strategy got slaughtered alongside the benchmark index.
It is easy to create long-only systems since 2009 as we are in the biggest bull market in history. Testing on longer data sets shows you where your strategy is vulnerable or could be improved, hence, why we added filters during the NQ in sample testing. Too much or too little sample testing is a double-ended sword, sometimes just creating a system for the recent market conditions can outperform by a large margin in the short run that you could add advanced money management tactics and position sizing features to reduce size when performance begins to wane, at the same time you can introduce other recent outperformance systems – bear in mind this is a very difficult challenge and the strategy is more about the strength of money management and position sizing system created.
Running the System as a Portfolio on Different Intervals
The performance could be improved by testing other intervals, in this strategy we are entering at the close of the 5-minute bar. You could test this on other intervals and improve the performance. Alternatively, to enhance the performance further you could introduce advanced position sizing techniques and run the strategy on other correlated markets with different intervals, this should reduce the daily equity trade correlation. We have encountered strong systems that run the same strategy with equal weighting across multiple intervals especially when there is a guaranteed signal generated at the start of the day.
Criticisms
One could argue the momentum strategy is just tracking the overall benchmark market which has been in a very strong bull market for a long time. We can look at the performance during the bear market years and see we had week performance primarily during the dot com crash (which was expected). On the flip side the strategy performed excellently during the 2008 crash and COVID crash in March 2020 – this shows positive Alpha during a period where the market crashed (the fact the system was day trade only meant it avoided the overnight limit down moves).
Another criticism would be the profit factor and net profit will be too small when we factor in commission and slippage – this is certainly true. Readers must remember that this is a basic strategy for new developers and traders to consider, this is “the keep it simple approach” with limited rules and that tends to create more robust systems. The strategy should be a thought experiment and a springboard for future system development work. We are demonstrating that a simple system can be designed without an indicator or optimization. If you were to work on this strategy then you should develop reliable stops and targets and more importantly correct position sizing algorithms to trade multiple correlated markets, position sizing is seemingly a more important feature than the entry signal.
The testing process is limited and inadequate, this is again true. There are many ways to perform in-sample and out of sample testing and we agree the testing process could be improved greatly. This article is aimed at new traders, we provide guidance on basic sample testing methodology which is more than adequate for this test and they should look at reading other testing methodologies for future strategies and testing.
The filters are curve fitted and reduce the sample trades significantly without increasing the profit factor by any reasonable margin – this is a true statement. To create robust strategies there are two schools of thought, the first is that limiting the number of rules leads to more robust systems, the alternative for academics and maths focused traders/programmers demand complexity, in our experience, there is no right or wrong answer so do not be perturbed by those saying it is too simple, the profit and loss will show you over time quite quickly whether the system will work or not. However, many traders release rushed and not tested trading strategies just to take the advantage of the largest bubble in modern history. But don’t get me wrong, investors should be fast enough to benefit of the current bubble. Just make sure that you secure your investment when the market crashes and your trading strategy is profitable in all market conditions.
7. Conclusion
We demonstrate to new traders and developers that taking basic day trading knowledge and creating a logical rule to capture momentum which we can test on in-sample data periods and on correlated markets to ensure there is a positive expectancy. This is a good starting point particularly for understanding how different market themes will influence profitability and why testing across correlated markets during bear/bull markets is a good idea.
This simple momentum indicator is also a good starting point for day traders looking to transition over to system trading without extensive coding experience or mathematical tools/knowledge.
We would not trade this system for many reasons such as the filters cut to many sample trades whilst not improving the profit factor by a wide margin. The rule simply means that it is tracking the overall trend of the market which is in the closing phase of a very strong Bull market. To take advantage of the strong overnight trending moves you could create a better swing or longer-term strategy which will have lower transaction costs and improved net profitability. But can you profit from this strategy in the long run? That is the question you need to ask yourself when trading with any kind of strategy. Whilst many traders are still trying to find the trading edge, Quant Savvy algorithmic trading systems continue to show strong performance over the years. Contact us for more information and live results.